Image Details
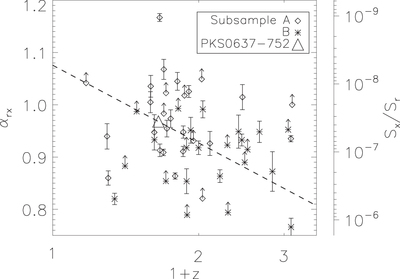
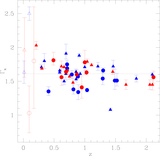
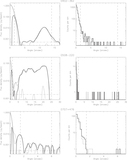
Caption: Figure 11.
Plot of αrx against redshift. A value of αrx of 1.0 indicates that there is equal power per logarithmic frequency interval in both the X-ray and radio bands. The right axis gives the ratio of the X-ray and radio flux densities (Sx and Sr). As a reference, the result for PKS 0637-752 is indicated. The dashed line gives the dependence of αrx on z under the assumptions that the X-ray emission results only from inverse Compton scattering off of the cosmic microwave background and that the beaming parameters for all jets are the same as those of PKS 0637−752. In this model, the X-ray-to-radio flux density ratio would increase as (1 + z)3+α (where we assume α = 0.5), but such a dependence is not apparent.
Other Images in This Article

Show More
Copyright and Terms & Conditions
© 2018. The American Astronomical Society.