Image Details
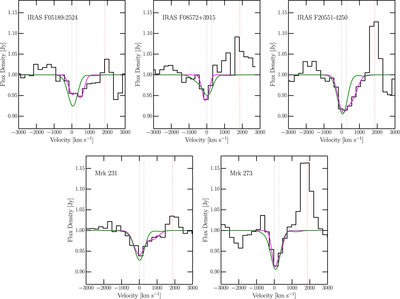
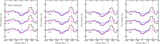
Caption: Figure 7.
OH 35 spectra normalized to the continuum. Red and blue lines are the two Gaussian components of the fitted line, and the magenta line is the sum of the two components. The green line is the profile predicted by the radiative transfer model described in González-Alfonso & Cernicharo (1999) and González-Alfonso et al. (2017). The modeled line profiles are constrained by observations of 4 OH lines at 65, 79, 84, and 119 μm.
Other Images in This Article
Copyright and Terms & Conditions
© 2018. The American Astronomical Society. All rights reserved.
Copyright ©
2025 Astronomy Image Explorer. All Rights Reserved.