Image Details
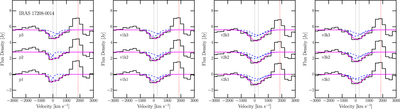
Caption: Figure 4.
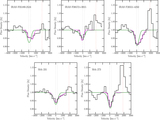
Examples of OH 35 line profile fits for each of the 12 different continuum-subtracted spectra in IRAS F17208-0014. Line colors and styles are the same as that for Figure 3. “p1, p2, p3” indicate first-, second-, and third-order polynomial fits to the continuum, respectively. “v1” refers to the “lower-limit” pivot points in Figure 1. “v2” refers to the “upper-limit” pivot points, and “v3” to the best-fit-by-eye pivot points. “k1, k2, k3” are the orders of the spline fitted to the continuum. For example, “v2k3” is the third-order spline fit to the continuum using the upper-limit pivot points. The gray dotted vertical lines mark the rest wavelengths of the OH 35 doublet (34.60 and 34.63 μm) at systemic velocity.
Other Images in This Article
Copyright and Terms & Conditions
© 2018. The American Astronomical Society. All rights reserved.