Image Details
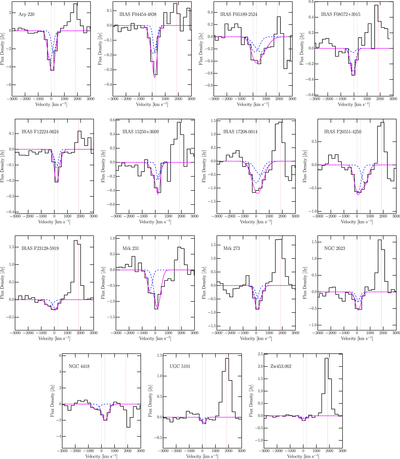
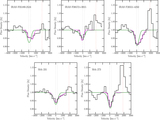
Caption: Figure 3.
Two Gaussian fits to the continuum-subtracted OH 35 line profiles of the 15 objects in our sample; see Section 3.3. In each figure, the solid black histogram is the data. Blue dashed lines indicate the two Gaussian components that best fit the line profile, and the magenta line is the sum of those two components. The gray dotted vertical lines mark the rest wavelengths of the OH 35 doublet (34.60 and 34.63 μm) at a systemic velocity. The red dotted vertical line marks the location of the [Si II] emission line at 34.815 μm.
Other Images in This Article
Copyright and Terms & Conditions
© 2018. The American Astronomical Society. All rights reserved.
Copyright ©
2025 Astronomy Image Explorer. All Rights Reserved.