Image Details
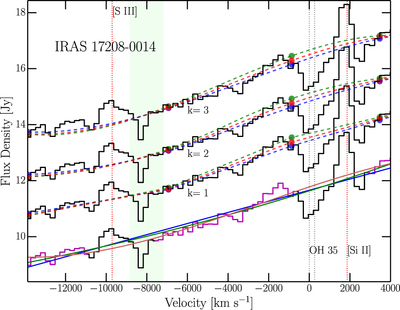
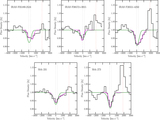
Caption: Figure 1.
Example of 12 different continuum fits to the mid-infrared spectrum of IRAS F17208-0014. The black solid histograms are the data separated from each other by an arbitrary offset. Spline pivot points are anchored at wavelengths of 33.0, 33.8, 34.5, and 35.0 μm. The blue, green, and red dots indicate the set of pivot points that are, respectively, the lower limits (v1), upper limits (v2), and “best-fit-by-eye” values (v3) used to fit a continuum spline. The top most set of fits is the result of using a third-order (k = 3) spline fit to each pivot point set. Below are the results for second-order (k = 2) and first-order (k = 1) spline fits. In each case, the blue, green, and red dotted lines show the results of the spline fits to the lower-limit, upper-limit, and best-fit-by-eye continuum flux pivot points. The last spectrum at the bottom is fit with a polynomial. The magenta regions in this spectrum indicate the regions used to fit the first (solid blue line), second (solid green line), and third (solid red line) order polynomials to the continuum. The two dotted vertical lines in gray mark the rest wavelengths of the OH 35 doublet (34.60 and 34.63 μm) at a systemic velocity. The dotted vertical lines in red mark the locations of the emission features [S III] 33.48 μm and [Si II] 34.82 μm. The vertical light-green band shows the region where a 20% dip in the detection response in the NOD 1 position occurs.
Other Images in This Article
Copyright and Terms & Conditions
© 2018. The American Astronomical Society. All rights reserved.