Image Details
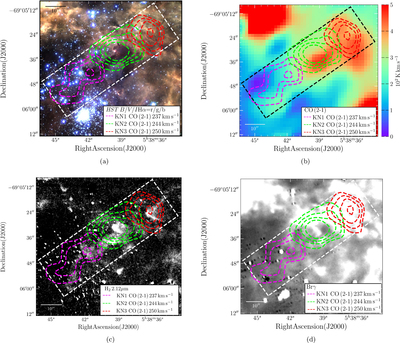
Caption: Figure 2.
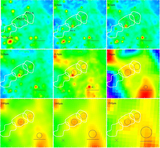
(a) The stapler nebula enlarged from the HST mosaic in Figure 1. The stapler region is outlined with the dashed white box. The CO(2–1) contours integrated over 235–240 km s−1, 240–245 km s−1, and 245–250 km s−1 are shown in magenta, green, and red respectively and given in the bottom right corner, with the peak velocities of each cloud. The scale bar marks ﹩10^{\prime\prime} ﹩ (at the distance to 30 Doradus, ﹩10^{\prime\prime} \approx 2.5﹩ pc). (b) The total integrated CO(2–1) emission over entire velocity range with the color scale giving the intensity of the emission in 102 K km s−1. The CO contours from Figure 2(a) are shown, and the region delineating the stapler nebula is marked by the black dashed lines. (c) Grayscale VLT-ISAAC image of H2 2.12 μm emission showing the excited molecular gas in the stapler nebula. Scale is logarithmic. The corresponding cold molecular gas from Figure 2(a) and the boundary of the stapler region are shown. The clumpy H2 emission coincides spatially with the center of each CO cloud knot. (d) Grayscale Brγ emission, with the contours from Figure 2(a) and the boundary of the stapler nebula overlaid. Stretch is on a linear scale. In contrast to the H2 emission, the Brγ emission shows no strong spatial coincidence with the centers, but rather with the weakest CO(2–1) contours. A description of the data presented in the figure is found in Section 2, with a discussion in Section 4.
Other Images in This Article
Copyright and Terms & Conditions
© 2018. The American Astronomical Society. All rights reserved.