Image Details
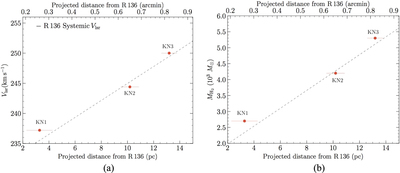
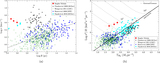
Caption: Figure 5.
(a) The peak velocity in the frame of the local standard of rest (﹩{V}_{\mathrm{lsr}}﹩) of each cloud is plotted as a function of projected distance from R136. The upper y-axis gives the projected distance in arcmin, while the lower y-axis gives it in parsecs assuming a distance of 50 kpc. The best-fit relation is given by the dashed line and has a slope of ∼1.5. (b) The mass of each cloud ﹩{M}_{{{\rm{H}}}_{2}}﹩ is plotted as a function of projected distance from R136. The upper y-axis gives the projected distance in arcmin, while the lower y-axis gives it in parsecs assuming a distance of 50 kpc. The best-fit relation is given by the dashed line.
Other Images in This Article
Copyright and Terms & Conditions
© 2018. The American Astronomical Society. All rights reserved.