Image Details
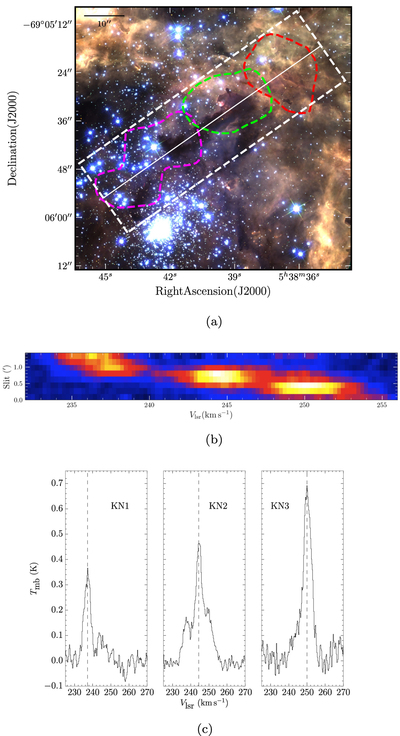
Caption: Figure 3.
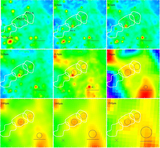
(a) The stapler nebula enlarged from the HST mosaic in Figure 1, with the stapler region outlined with the dashed white box. The outermost CO(2–1) contours integrated over 235–240 km s−1 and 245–250 km s−1 are shown in magenta and red respectively, with the second outermost contour of 240–245 km s−1 also shown. The solid white line marks the position of the slice shown in (b). (b) Position–velocity slice of the CO(2–1) cube on a linear scale along the direction of the slit given by the solid white line in (a). The slit cuts along the center of the stapler nebula. (c) CO(2–1) spectra of each cloud extracted from the region bounded by the contours shown in (a). The dashed line for each cloud is its ﹩{V}_{\mathrm{lsr}}﹩ given in Table 1.
Other Images in This Article
Copyright and Terms & Conditions
© 2018. The American Astronomical Society. All rights reserved.