Image Details

Caption: Figure 9.
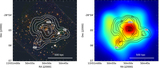
Subaru S/N map obtained by 1000 bootstraps of the Subaru source catalog. The signal is the original convergence map, and the noise is determined from the standard deviation of the bootstrapped convergence maps. The peak of the mass distribution is detected at ﹩9\sigma ﹩ significance, and the substructures to the NW and SE are detected at ﹩3\sigma ﹩ significance.
Other Images in This Article

Show More
Copyright and Terms & Conditions
© 2017. The American Astronomical Society. All rights reserved.
Copyright ©
2025 Astronomy Image Explorer. All Rights Reserved.