Image Details
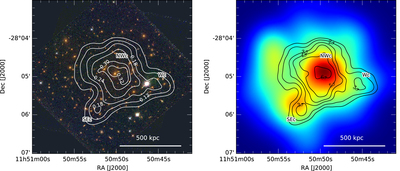
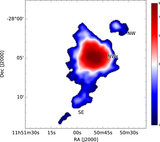
Caption: Figure 10.
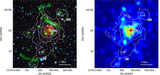
Left: HST convergence overlaid on HST color-composite image. The color-composite HST image is created using F435W+F475W, F606W, and F814W to represent intensities in blue, green, and red, respectively. The BCG is located within the highest convergence contour. The high resolution of the HST convergence map allows the detection of the SEc substructure ﹩\sim 400\,\mathrm{kpc}﹩ SE of the BCG. Also of note is the extension of the convergence to the west. Right: S/N contours plotted over the luminosity density of the HST cluster member catalog. The primary peak is detected at the ﹩6\sigma ﹩ level. The SEc luminosity peak has a corresponding convergence peak, but an offset is visible. The western convergence peak has a weak luminosity counterpart.
Other Images in This Article

Show More
Copyright and Terms & Conditions
© 2017. The American Astronomical Society. All rights reserved.