Image Details

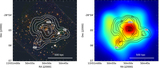
Caption: Figure 8.
Left: color-composite Subaru image with enhanced radio (green) and X-ray (red) emissions. Radio emissions are from GRMT observations (Bonafede et al. 2014), and X-ray emissions are from XMM-Newton. The overlaid convergence contours (white) peak in the X-ray-emitting ICM, with the highest contour enveloping the BCG. The mass is distributed along a direction similar to the axis connecting the radio relics. The HST F814W pointing is outlined in light blue. Right: mass distribution overlaid on the Subaru cluster member catalog luminosity density. The luminosity density has a bimodal distribution in the cluster center, with the NWc luminosity peak consistent with the mass peak. The SEc luminosity peak has no clear mass counterpart in the Subaru mass reconstruction.
Other Images in This Article

Show More
Copyright and Terms & Conditions
© 2017. The American Astronomical Society. All rights reserved.