Image Details
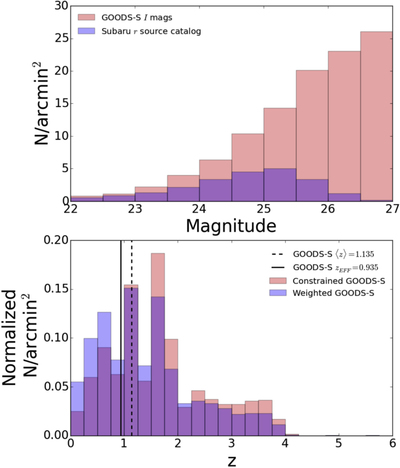
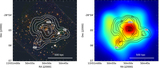
Caption: Figure 6.
Estimation of the effective redshift for Subaru source catalog galaxies using the GOODS-S photometric redshift catalog of Dahlen et al. (2010). The GOODS-S catalog is modeled to represent the redshift distribution of our Subaru source catalog. Top: number density of objects in the color- and magnitude-constrained GOODS-S catalog (red bars) and the Subaru source catalog (blue bars) highlights the difference in depth between the two catalogs. Bottom: redshift distribution of the GOODS-S catalog before (red) and after (blue) correcting for depth and applying Equation (18).
Other Images in This Article

Show More
Copyright and Terms & Conditions
© 2017. The American Astronomical Society. All rights reserved.
Copyright ©
2025 Astronomy Image Explorer. All Rights Reserved.