Image Details

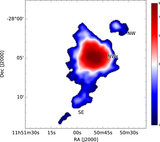
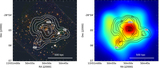
Caption: Figure 7.
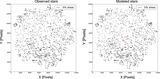
Left: whisker plot of the Subaru reduced shear determined by averaging the galaxy ellipticities within an ﹩r=80^{\prime\prime} ﹩ top-hat kernel. The direction and length of the whiskers represent the direction and magnitude of the reduced shear. The shear tends to be tangential to the cluster center and increase in magnitude toward the cluster center (around ﹩{11}^{{\rm{h}}}{50}^{{\rm{m}}}{45}^{{\rm{s}}},-28^\circ 05^{\prime} ﹩). Right: Subaru convergence reconstructed by the inversion (Equation (10)) of the shear map. The mass reconstruction shows a clear peak. Low convergence detections are seen to the NW and SE.
Other Images in This Article

Show More
Copyright and Terms & Conditions
© 2017. The American Astronomical Society. All rights reserved.