Image Details
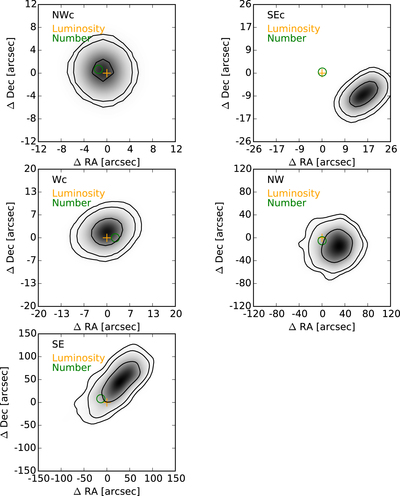
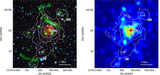
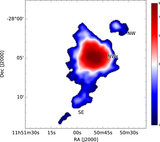
Caption: Figure 14.
Mass–galaxy offset significance for each of the substructures. Black contours show confidence levels of ﹩1\sigma ﹩, ﹩2\sigma ﹩, and ﹩3\sigma ﹩ for the mass peak distribution determined from bootstrapping. Plots are centered on the luminosity centroid (orange plus sign). Galaxy number density centroids are marked with a green circle.
Other Images in This Article

Show More
Copyright and Terms & Conditions
© 2017. The American Astronomical Society. All rights reserved.
Copyright ©
2025 Astronomy Image Explorer. All Rights Reserved.