Image Details
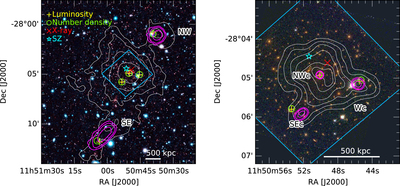
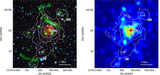
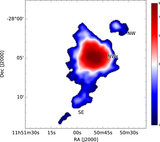
Caption: Figure 11.
Convergence peak distributions (magenta contours) determined from the bootstrapped convergence realizations. Convergence peaks are found within top-hat priors that are centered on the local luminosity centroid. The peaks are smoothed using a Gaussian kernel density estimator, and the ﹩1\sigma ﹩, ﹩2\sigma ﹩, and ﹩3\sigma ﹩ contours are plotted. Galaxy luminosity and density centroids are shown, as well as X-ray and SZ peaks from Bagchi et al. (2011). Left: peak distributions of the NW and SE convergence are found using the Subaru bootstraps. Subaru weak-lensing mass contours (white) are shown for reference. Right: peak distributions of the NWc, SEc, and Wc peaks from HST bootstraps. The HST peak distributions may be influenced by the tight priors that are required to prevent influence from neighboring peaks.
Other Images in This Article

Show More
Copyright and Terms & Conditions
© 2017. The American Astronomical Society. All rights reserved.