Image Details
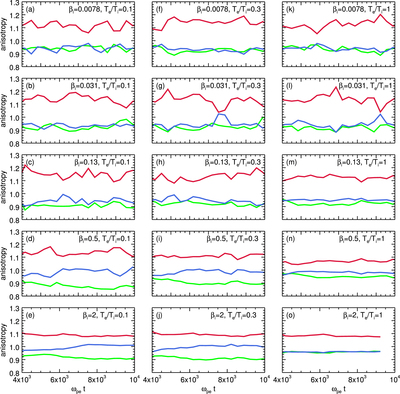
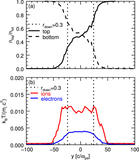
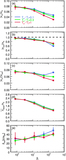
Caption: Figure 25.
Time evolution of the anisotropy ratios in the reconnection downstream for a range of ﹩{\beta }_{{\rm{i}}}﹩(increasing from top to bottom, as indicated in the legends) and ﹩{T}_{{\rm{e}}}/{T}_{{\rm{i}}}﹩(0.1 in the left column, 0.3 in the middle column, 1 in the right column). Here, ﹩{\sigma }_{w}=0.1﹩ and ﹩{m}_{{\rm{i}}}/{m}_{{\rm{e}}}=25﹩. Red, green, and blue curves correspond to the ratios ﹩{r}_{x},{r}_{y},﹩ and rz (Equations (35)–(37)). Time evolution is shown starting at ﹩{\omega }_{\mathrm{pe}}t=4\times {10}^{3},﹩ at which point the downstream region used for our heating measurements reaches a quasi-steady state.
Other Images in This Article
Show More
Copyright and Terms & Conditions
© 2017. The American Astronomical Society. All rights reserved.