Image Details
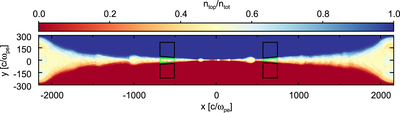
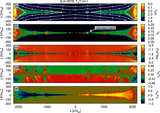
Caption: Figure 3.
2D plot of the ratio of top to total particle density, ﹩{n}_{\mathrm{top}}/{n}_{\mathrm{tot}},﹩ for a representative simulation with ﹩{\beta }_{{\rm{i}}}=0.0078﹩ and ﹩{T}_{{\rm{e}}}/{T}_{{\rm{i}}}=0.1﹩ (A[0] in Table 1) at time ﹩t\approx \mathrm{11,000}\,{\omega }_{\mathrm{pe}}^{-1}\approx 0.8\,{t}_{{\rm{A}}}﹩. The green and black contours show the boundaries of the regions we use to calculate the downstream and upstream temperatures, respectively. The box edges at the interface between upstream and downstream change as the system evolves, and are calculated according to Equations (7) and (8). Particle mixing serves as a tracer for the downstream region. Particles from the top (﹩y\gt 0﹩) of the domain are tagged; as they enter the reconnection layer, they mix with particles from the bottom (﹩y\lt 0﹩) of the domain. The reconnection downstream is identified via the mixing fraction ﹩{n}_{\mathrm{top}}/{n}_{\mathrm{tot}}﹩ and a choice of the threshold ﹩{r}_{\mathrm{down}},﹩ as in Equation (7).
Other Images in This Article
Show More
Copyright and Terms & Conditions
© 2017. The American Astronomical Society. All rights reserved.