Image Details
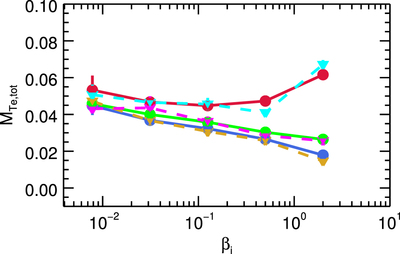
Caption: Figure 22.
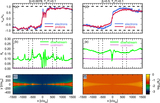
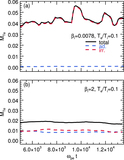
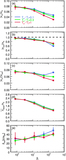
Comparison of outflow and periodic simulations (with ﹩{\sigma }_{w}=0.1﹩ and ﹩{m}_{{\rm{i}}}/{m}_{{\rm{e}}}=25﹩), in terms of the dependence of ﹩{M}_{T{\rm{e}},\mathrm{tot}}﹩ on ﹩{\beta }_{{\rm{i}}}﹩ and ﹩{T}_{{\rm{e}}}/{T}_{{\rm{i}}}﹩. Circles connected by solid lines show the results of periodic simulations, and inverted triangles connected by dashed lines indicate outflow simulations. For periodic runs, blue, green, and red correspond to runs with upstream temperature ratios ﹩{T}_{{\rm{e}}}/{T}_{{\rm{i}}}=0.1,0.3,﹩ and 1; for outflow, dark yellow, magenta, and cyan denote ﹩{T}_{{\rm{e}}}/{T}_{{\rm{i}}}=0.1,0.3,﹩ and 1.
Other Images in This Article
Show More
Copyright and Terms & Conditions
© 2017. The American Astronomical Society. All rights reserved.