Image Details
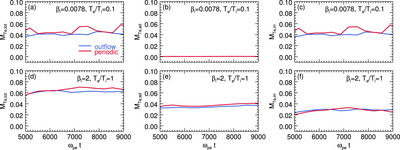
Caption: Figure 21.
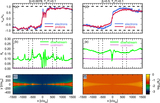
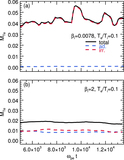
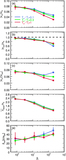
Comparison between outflow (blue) and periodic (red) simulations with ﹩{\sigma }_{w}=0.1﹩ and ﹩{m}_{{\rm{i}}}/{m}_{{\rm{e}}}=25﹩. We show the time evolution of (a) electron total heating fraction, ﹩{M}_{T{\rm{e}},\mathrm{tot}}﹩, for ﹩{\beta }_{{\rm{i}}}=0.0078,{T}_{{\rm{e}}}/{T}_{{\rm{i}}}=0.1;﹩ (b) electron adiabatic heating fraction, ﹩{M}_{T{\rm{e}},\mathrm{ad}}﹩, for ﹩{\beta }_{{\rm{i}}}=0.0078,{T}_{{\rm{e}}}/{T}_{{\rm{i}}}=0.1;﹩ (c) electron irreversible heating fraction, ﹩{M}_{T{\rm{e}},\mathrm{irr}}﹩, for ﹩{\beta }_{{\rm{i}}}=0.0078,{T}_{{\rm{e}}}/{T}_{{\rm{i}}}=0.1;﹩ (d) electron total heating fraction, ﹩{M}_{T{\rm{e}},\mathrm{tot}}﹩, for ﹩{\beta }_{{\rm{i}}}=2,{T}_{{\rm{e}}}/{T}_{{\rm{i}}}=1﹩; (e) electron adiabatic heating fraction, ﹩{M}_{T{\rm{e}},\mathrm{ad}}﹩, for ﹩{\beta }_{{\rm{i}}}=2,{T}_{{\rm{e}}}/{T}_{{\rm{i}}}=1﹩; (f) electron irreversible heating fraction, ﹩{M}_{T{\rm{e}},\mathrm{irr}}﹩, for ﹩{\beta }_{{\rm{i}}}=2,{T}_{{\rm{e}}}/{T}_{{\rm{i}}}=1﹩. The heating fractions are shown in the interval ﹩t=5\times {10}^{3}\,{\omega }_{\mathrm{pe}}^{-1}﹩ –﹩9\times {10}^{3}\,{\omega }_{\mathrm{pe}}^{-1},﹩ which corresponds to ﹩t\approx 0.36\,{t}_{{\rm{A}}}﹩–﹩0.64\,{t}_{{\rm{A}}}﹩ for the periodic simulations and ﹩t\approx 0.6\,{t}_{{\rm{A}}}﹩–﹩1\,{t}_{{\rm{A}}}﹩ for the outflow ones. The curves have been shifted in time to account for slightly different onsets of reconnection in periodic vs. outflow cases, due to different initialization of the current sheet.
Other Images in This Article
Show More
Copyright and Terms & Conditions
© 2017. The American Astronomical Society. All rights reserved.