Image Details
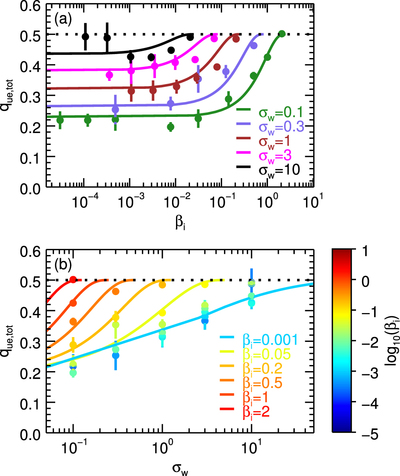
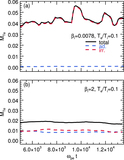
Caption: Figure 17.
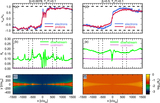
Comparison of the electron-to-overall heating ratio ﹩{q}_{u{\rm{e}},\mathrm{tot}}﹩ between our simulations with ﹩{m}_{{\rm{i}}}/{m}_{{\rm{e}}}=1836﹩ and ﹩{T}_{{\rm{e}}}/{T}_{{\rm{i}}}=1﹩ (filled circles with error bars) and the best-fitting formula in Equation (34) (solid curves). We show the dependence on (a) plasma-﹩{\beta }_{{\rm{i}}}﹩ and (b) magnetization ﹩{\sigma }_{w}﹩. In panel (a), the different colors represent magnetizations ﹩{\sigma }_{w}=0.1﹩ (green), 0.3 (purple), 1 (brown), 3 (magenta), and 10 (black). In panel (b), the color coding of the curves is indicated in the legend (from cyan to red for increasing ﹩{\beta }_{{\rm{i}}}﹩), while the color of the filled points refers to the color bar on the right. In both panels, the black dotted line at ﹩{q}_{u{\rm{e}},\mathrm{tot}}=0.5﹩ shows the limit of comparable heating efficiencies between electrons and protons, expected when ﹩{\beta }_{{\rm{i}}}\to {\beta }_{{\rm{i}},\max }﹩ (regardless of ﹩{\sigma }_{w}﹩) or ﹩{\sigma }_{w}\gg 1﹩ (independently of ﹩{\beta }_{{\rm{i}}}﹩).
Other Images in This Article
Show More
Copyright and Terms & Conditions
© 2017. The American Astronomical Society. All rights reserved.