Image Details
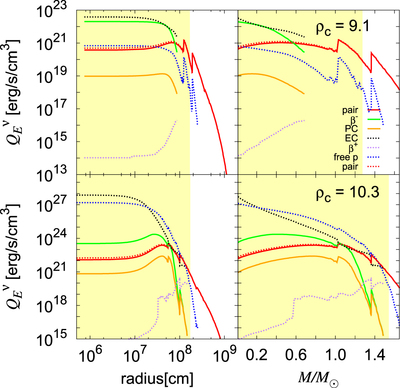
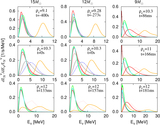
Caption: Figure 8.
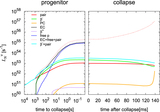
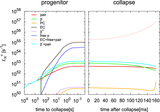
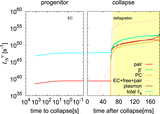
Radial profiles of the energy emissivities from different processes for the ﹩15\ {M}_{\odot }﹩ progenitor model. Top and bottom panels show the results when the central density is ﹩{\mathrm{log}}_{10}{\rho }_{c}/[{\rm{g}}\ {\mathrm{cm}}^{-3}]=9.1﹩ and 10.3, respectively. In the left panels, the radius is used as the horizontal axis, whereas in the right panels, the mass coordinate is employed. The line types and color coding are the same as in Figure 5. We define the Fe cores as the regions where the electron fraction satisfies ﹩{Y}_{e}\lt 0.495﹩, and they are in yellow in this figure.
Other Images in This Article
Show More
Copyright and Terms & Conditions
© 2017. The American Astronomical Society. All rights reserved.
Copyright ©
2026 Astronomy Image Explorer. All Rights Reserved.