Image Details
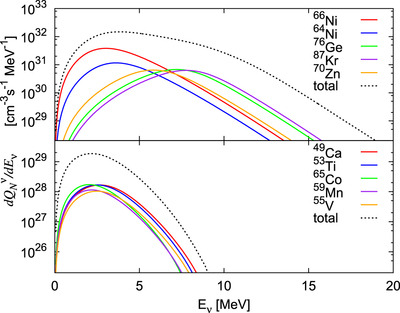
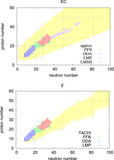
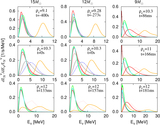
Caption: Figure 10.
Energy spectra for EC and ﹩{\beta }^{-}﹩ decay by the dominant heavy nuclei given in Table 2 at the time when the central density becomes ﹩{\mathrm{log}}_{10}{\rho }_{c}/[{\rm{g}}\ {\mathrm{cm}}^{-3}]=10.3﹩. The top panel shows the ﹩{\nu }_{e}﹩ spectrum for EC, while the bottom panel displays the ﹩{\bar{\nu }}_{e}﹩ spectrum for ﹩{\beta }^{-}﹩ decay. The EC rates are evaluated at ﹩r=3.1\times {10}^{5}\,\mathrm{cm}﹩, where the density, temperature, electron fraction, and chemical potential are ﹩{\mathrm{log}}_{10}\rho /[{\rm{g}}\ {\mathrm{cm}}^{-3}]=10.3﹩, ﹩T=0.861\,\mathrm{MeV}﹩, Ye = 0.417, and ﹩{\mu }_{e}=11.9﹩ MeV, respectively. The rates of ﹩{\beta }^{-}﹩ decay are calculated at ﹩r=2.7\times {10}^{7}\,\mathrm{cm}﹩, where they are largest, and ﹩{\mathrm{log}}_{10}\rho /[{\rm{g}}\ {\mathrm{cm}}^{-3}]\,=9.79﹩, ﹩T=0.856\,\mathrm{MeV}﹩, Ye = 0.423, and ﹩{\mu }_{e}=7.87﹩ MeV.
Other Images in This Article
Show More
Copyright and Terms & Conditions
© 2017. The American Astronomical Society. All rights reserved.