Image Details
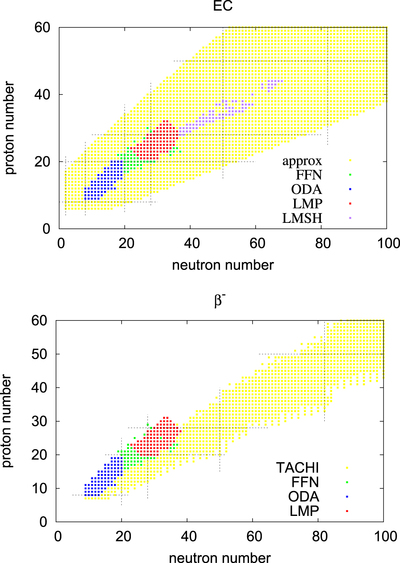
Caption: Figure 4.
Nuclear charts indicating in different colors the nuclear species with the reaction rates for EC (left) and ﹩{\beta }^{-}﹩ decay (right) given in the LMSH (black; Langanke et al. 2003), LMP (red; Langanke & Martínez-Pinedo 2001), ODA (blue; Oda et al. 1994), FFN (green; Fuller et al. 1985), and TACHI (yellow; Tachibana & Yamada 1995; Tachibana 2000; Yoshida & Tachibana 2000; Koura et al. 2003; Koura 2004; Koura et al. 2005) tables, as well as using the approximation formula (yellow; Equation (22)).
Other Images in This Article
Show More
Copyright and Terms & Conditions
© 2017. The American Astronomical Society. All rights reserved.
Copyright ©
2024 Astronomy Image Explorer. All Rights Reserved.