Image Details
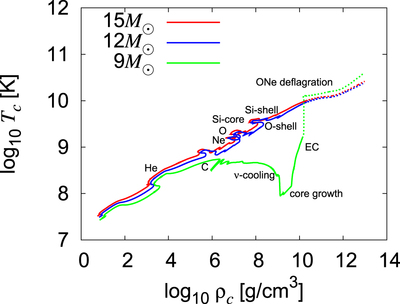
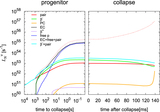
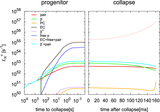
Caption: Figure 1.
Evolutionary paths of the central density and temperature for three progenitors. The red, blue, and green curves correspond to the 15, 12, and ﹩9\ {M}_{\odot }﹩ models, respectively. The evolutions in both the progenitor phase (solid lines) and collapse phase (dotted lines) are presented. The initiation points of some major nuclear burnings as well as the evolutionary stages defined by Takahashi et al. (2013) for the ONe-core progenitors are marked with labels.
Other Images in This Article
Show More
Copyright and Terms & Conditions
© 2017. The American Astronomical Society. All rights reserved.
Copyright ©
2026 Astronomy Image Explorer. All Rights Reserved.