Image Details
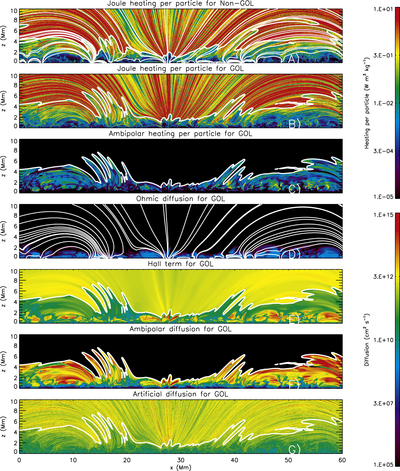
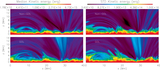
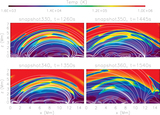
Caption: Figure 8.
From top to bottom: maps of the Joule heating from the artificial diffusion for the non-GOL (panel (a)) and GOL simulation (panel (b)) and from the ambipolar diffusion (panel (c)), and ohmic diffusion (panel (d)), Hall term (panel (e)), ambipolar diffusion (panel (f)), and numerical diffusion (panel (g)) at t = 800 s (snapshot = 280). Panels (a) and (d) show magnetic field lines in white, and the other panels show the transition from the chromosphere to the corona as white contours (contour of ﹩T={10}^{5}﹩ K). These maps reveal the importance of Joule heating from the ambipolar diffusion in the cold bubbles and upper chromosphere. The color schemes are in logarithmic scale.
Other Images in This Article
Show More
Copyright and Terms & Conditions
© 2017. The American Astronomical Society. All rights reserved.