Image Details
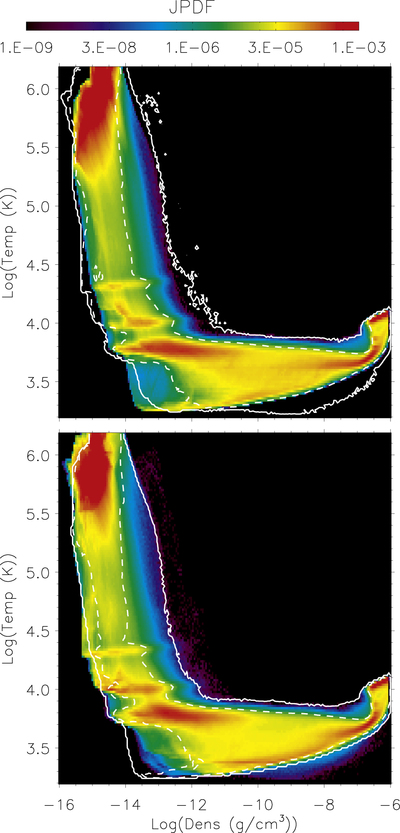
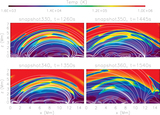
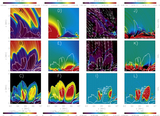
Caption: Figure 3.
JPDF of temperature (vertical axis) and density (horizontal axis) over 11 minutes (between snapshots 300 and 370) for non-GOL (top) and GOL (bottom) simulations. The white contours correspond to the temperature and density regime of the whole simulation (solid) and at JPDF = ﹩5\times {10}^{-5}﹩ (dashed) for non-GOL (bottom, whereas the color map corresponds to the simulation GOL) and GOL (top, whereas the color map corresponds to the simulation non-GOL) simulations in order to simplify the comparison.
Other Images in This Article
Show More
Copyright and Terms & Conditions
© 2017. The American Astronomical Society. All rights reserved.
Copyright ©
2025 Astronomy Image Explorer. All Rights Reserved.