Image Details
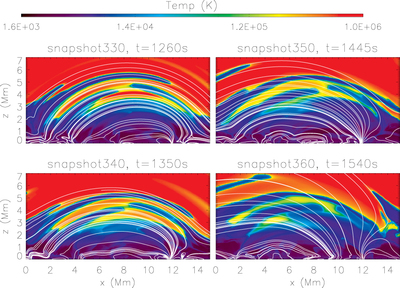
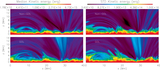
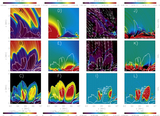
Caption: Figure 6.
Temperature, in logarithmic scale, for the GOL simulation at t = 1260 s (top left), 1350 s (bottom left), 1445 s (top right), and 1540 s (bottom right) with magnetic field lines shown in white. In the beginning (left panels) the thermodynamic structures are aligned with the magnetic field, whereas at later times (right panels) the magnetic connectivity has changed and the alignment is poor (see corresponding Movie 1).
(An animation of this figure is available.)
The video/animation of this figure is available in the online journal.
Other Images in This Article
Show More
Copyright and Terms & Conditions
© 2017. The American Astronomical Society. All rights reserved.
Copyright ©
2025 Astronomy Image Explorer. All Rights Reserved.