Image Details
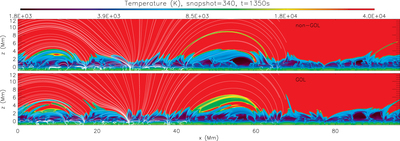
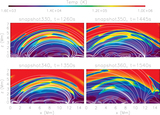
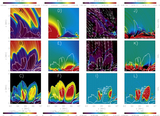
Caption: Figure 2.
Temperature maps for the non-GOL simulation (top panel) and GOL simulation (bottom panel) reveal large differences in the thermal properties. The temperature is shown in a logarithmic scale. Magnetic field lines are drawn on the left-hand side of the temperature map in order to show clearly the temperature map on the right-hand side.
Other Images in This Article
Show More
Copyright and Terms & Conditions
© 2017. The American Astronomical Society. All rights reserved.
Copyright ©
2025 Astronomy Image Explorer. All Rights Reserved.