Image Details
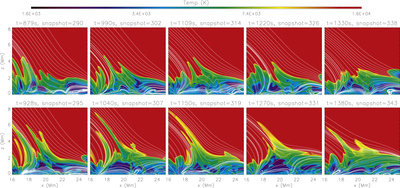
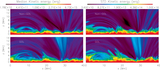
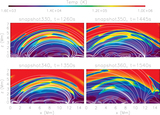
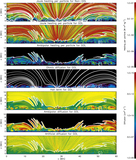
Caption: Figure 12.
Time series of temperature maps showing spicule evolution in the non-GOL simulation (top) and the GOL simulation (bottom) in the region ﹩x=[16,25]﹩ Mm. Magnetic field is drawn with white lines (see the corresponding Movie 2).
(An animation of this figure is available.)
The video/animation of this figure is available in the online journal.
Other Images in This Article
Show More
Copyright and Terms & Conditions
© 2017. The American Astronomical Society. All rights reserved.
Copyright ©
2025 Astronomy Image Explorer. All Rights Reserved.