Image Details
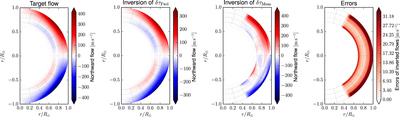
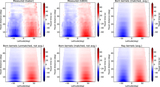
Caption: Figure 8.
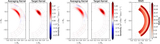
Inversion results for meridional flows. Shown are (from left to right) target flows (flow profile from the simulation convolved with target kernels), inverted flows from forward-modeled travel times (δτFwd) and measured travel times (δτMeas), as well as inversion errors for the inversion of measured travel times. Gray dashed lines indicate locations at r/R⊙ = 0.7, 0.8, 0.9, and 1.0 and multiples of 15° distance from the equator.
Other Images in This Article
Copyright and Terms & Conditions
© 2017. The American Astronomical Society. All rights reserved.
Copyright ©
2026 Astronomy Image Explorer. All Rights Reserved.