Image Details
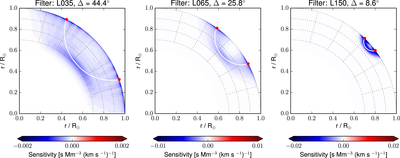
Caption: Figure 1.
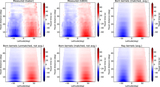
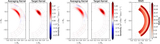
Example kernels for point-to-arc travel times for a central latitude of 40.°5 and a travel distance given in each panel. The kernels were averaged in the same way as is done for the travel times in the data analysis procedure in Section 4 and integrated over longitude. A ray path connecting the nominal location of the observation points (red dots) is also shown (white line). See Table 1 for details on the filters used.
Other Images in This Article
Copyright and Terms & Conditions
© 2017. The American Astronomical Society. All rights reserved.
Copyright ©
2026 Astronomy Image Explorer. All Rights Reserved.