Image Details
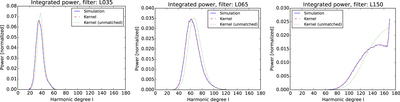
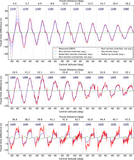
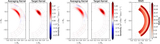
Caption: Figure 3.
Comparison of the same power spectra as in Figure 2, integrated over frequency. The observational power spectra from simulated data (blue solid line) and model power spectra (red dashed, matched) are nearly identical. Unmatched power spectra are also shown (green dots).
Other Images in This Article
Copyright and Terms & Conditions
© 2017. The American Astronomical Society. All rights reserved.
Copyright ©
2026 Astronomy Image Explorer. All Rights Reserved.