Image Details
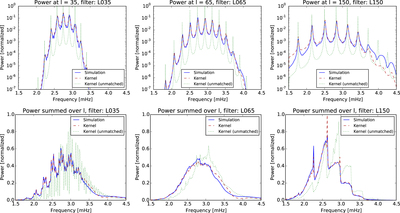
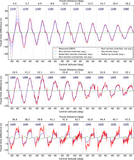
Caption: Figure 2.
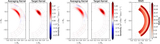
Comparison of filtered zero-order model power spectra with simulated data (blue lines) for three filters (different columns; for details on filters, see Table 1). The model power spectra were obtained with two different sets of mode frequencies and damping rates (red dashed: mode frequencies and damping rates fitted to the simulated power; green dotted: using Model S eigenfrequencies and MDI damping rates). Top row: cuts through the power spectra at the central harmonic degree of each filter. Bottom row: power spectra summed over l. All power spectra were normalized to total power equal to one.
Other Images in This Article
Copyright and Terms & Conditions
© 2017. The American Astronomical Society. All rights reserved.
Copyright ©
2026 Astronomy Image Explorer. All Rights Reserved.