Image Details
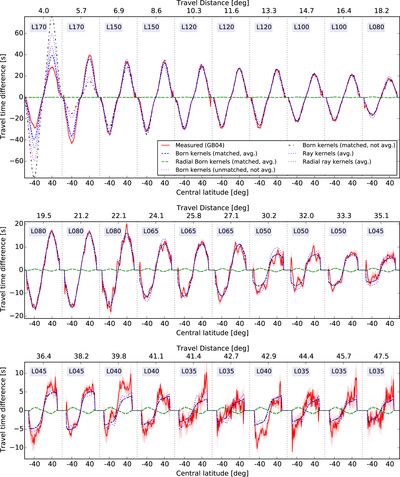
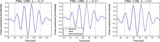
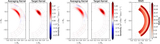
Caption: Figure 6.
Comparison of forward-modeled (all dashed, dotted, and dashed–dotted lines) and measured travel times (solid red) including measurement errors (light red regions). All travel times shown in this figure, apart from the impact of the radial flow component on the travel times (green), are also shown in Figure 5. For all travel distances (upper x-axis), delimited by vertical gray lines, the travel times are plotted as a function of the central latitude of the observation points (bottom x-axis). At each distance, the filter applied is indicated in a blue box, see also Table 1.
Other Images in This Article
Copyright and Terms & Conditions
© 2017. The American Astronomical Society. All rights reserved.
Copyright ©
2026 Astronomy Image Explorer. All Rights Reserved.