Image Details
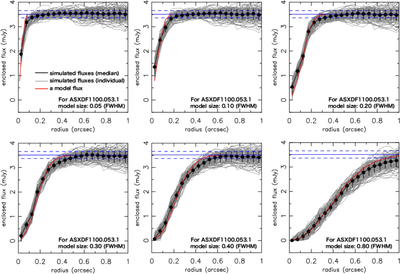
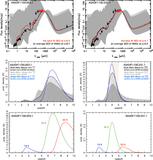
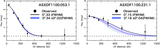
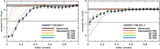
Caption: Figure 13.
Simulated enclosed fluxes using symmetric Gaussian models as a function of radius for ALMA data of ASXDF1100.053.1. Black dots and vertical lines mark medians and 1σ dispersions of the 100 simulated fluxes. Gray lines show enclosed fluxes of the 100 mock sources. The red line marks a raw flux of an input Gaussian model with a spatial sampling of 0.″05 pixel−1 (for a model size of 0.″05, a sampling of 0.″025 pixel−1). Blue solid and dashed lines mark the total flux and error of ASXDF1100.053.1 independently measured in the ALMA beam-convolved image. Here we plot model sizes of 0.″05, 0.″10, 0.″20, 0.″30, 0.″40, and 0.″80 (FWHM) as representatives of all simulated sizes.
Other Images in This Article
Show More
Copyright and Terms & Conditions
© 2017. The American Astronomical Society. All rights reserved.