Image Details
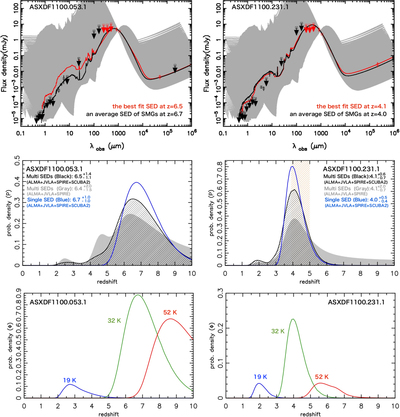
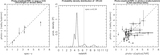
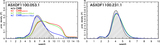
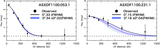
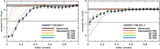
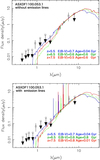
Caption: Figure 4.
Radio/(sub)mm photometric redshift of ASXDF1100.053.1 and 231.1. Top: Observed photometric data and model SEDs. Red open squares mark photometric data used in our radio/(sub)mm photometric redshift estimates: JVLA 6 GHz, ALMA 1100 μm, SCUBA-2 850 μm, and upper limits in the SPIRE bands. Black open squares mark photometric data not used in our redshift estimation. The red line is the best-fit SED at the best-fit redshift in photometric redshift estimation. The gray shaded area marks a range of all fit SEDs at all redshifts. The black line represents the averaged SED of ALMA-identified SMGs at the best-fit redshift presented in Section 4.4. Middle: Redshift probability density distributions of radio/(sub)mm photometric redshift. The black hatched curve marks the redshift probability density distribution. The gray curve shows this distribution without the SCUBA-2 850 μm data. The blue line marks the distribution of a single SED template, the average SED of ALMA-identified SMGs. The derived photometric redshift for each estimate is displayed in the panels. The orange hatched area marks a redshift range where the mid-IR color of ASXDF1100.231.1 is explained by the redshifted Hα emission line in the IRAC 3.6 μm band, as discussed in Section 6. Bottom: Probability densities (Φ) for individual SEDs of 19, 32, and 52 K using all (sub)mm/radio bands that contribute different Td temperatures to the combined photometric redshift.
Other Images in This Article
Show More
Copyright and Terms & Conditions
© 2017. The American Astronomical Society. All rights reserved.