Image Details
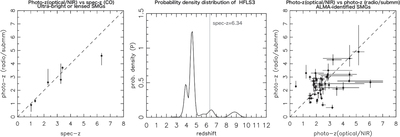
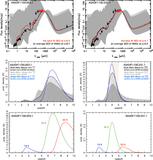
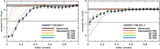
Caption: Figure 5.
Radio/(sub)mm photometric redshift estimation. Left: Comparison of radio/(sub)mm photometric redshift with spectroscopic redshift obtained via CO for six bright or lensed SMGs from the literature (Ivison et al. 2010; Ikarashi et al. 2011; Riechers et al. 2013; Wardlow et al. 2013; Messias et al. 2014). Middle: Redshift probability density distribution for HFLS3, shown to explain what happens when its redshift is estimated using radio/(sub)mm photometry. Right: Comparison of radio/(sub)mm photometric redshifts with optical/near-IR photometric redshifts for 46 ALMA-identified SMGs with radio detections (Simpson et al. 2014; Swinbank et al. 2014).
Other Images in This Article
Show More
Copyright and Terms & Conditions
© 2017. The American Astronomical Society. All rights reserved.