Image Details
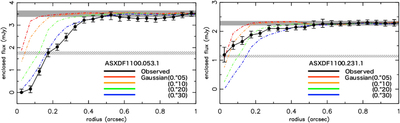
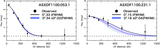
Caption: Figure 9.
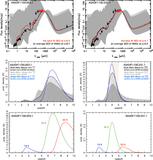
Enclosed flux densities as a function of radius measured in the clean component maps for ASXDF1100.053.1 and 231.1. The black solid line shows observed data. Colored dot–dashed lines show enclosed flux densities of models with Gaussian profiles with various sizes from 0.″05 to 0.″30 (FWHM). The enclosed flux density profiles of Gaussian models are reproduced in the same manner using the actual data, and are taken from simulations presented in the Appendix. Filled gray lines show total ALMA flux densities with errors measured independently in the beam-convolved ALMA images that are listed in Table 1. Hatched gray lines show half of the total ALMA flux densities with the errors for finding half-light radii.
Other Images in This Article
Show More
Copyright and Terms & Conditions
© 2017. The American Astronomical Society. All rights reserved.