Image Details
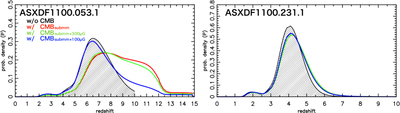
Caption: Figure 6.
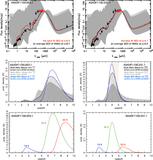
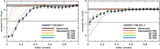
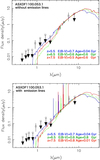
Redshift probability densities of radio/(sub)mm photometric redshift estimates when including the effects of the CMB for ASXDF1100.053.1 and 231.1. The gray curve is a probability density distribution without any CMB effects, i.e., it is the same plot shown in Figure 4. The red curve shows a probability density distribution with the CMB effect on observed (sub)mm flux densities. The green curve is a probability density distribution with the CMB effects on both (sub)mm and radio flux densities for B = 300 μG. The blue curve is for B = 100 μG. The redshift range is extended to z = 15 for ASXDF1100.053.1 due to the high probability of z ≥ 10. For the direct comparison with the result shown in Figure 4, the probability densities are scaled in z = 0–10.
Other Images in This Article
Show More
Copyright and Terms & Conditions
© 2017. The American Astronomical Society. All rights reserved.