Image Details
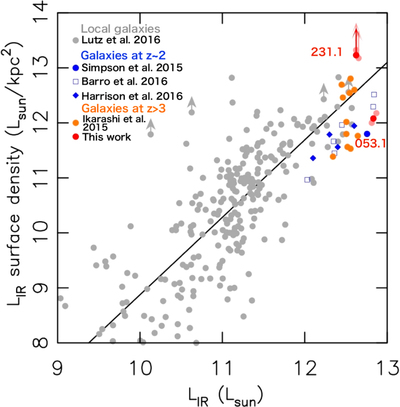
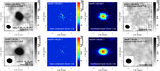
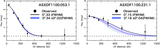
Caption: Figure 12.
IR luminosity vs. surface IR luminosity density plots for known local and high-redshift galaxies. Red dots mark ASXDF1100.053.1 at z = 6.5 and 231.1 at z = 5.5. Pink dots mark ASXDF1100.053.1 at z = 5.5 and 7.5, and 231.1 at z = 3.5 and 5.5, to show uncertainties due to redshift. Gray dots mark local galaxies, and the black solid line shows the fit line for local galaxies presented by Lutz et al. (2016). Blue markers show known z ∼ 2 galaxies: open squares mark so-called main-sequence galaxies (Barro et al. 2016), filled diamonds represent X-ray AGNs (Harrison et al. 2016), and the filled circle marks the median for SMGs (Simpson et al. 2015a). Orange dots mark z ≳ 3 candidate SMGs by Ikarashi et al. (2015). The sizes of these high-redshift galaxies in the literature come from measurements using ALMA data. LFIR (40–120 μm) was converted into LIR (rest-frame 8–1000 μm) based on an expected offset of 0.3 in log scale, based on the empirical far-IR/radio luminosity correlation (Yun et al. 2001) and the IR/radio luminosity correlation (Bell 2003).
Other Images in This Article
Show More
Copyright and Terms & Conditions
© 2017. The American Astronomical Society. All rights reserved.