Image Details
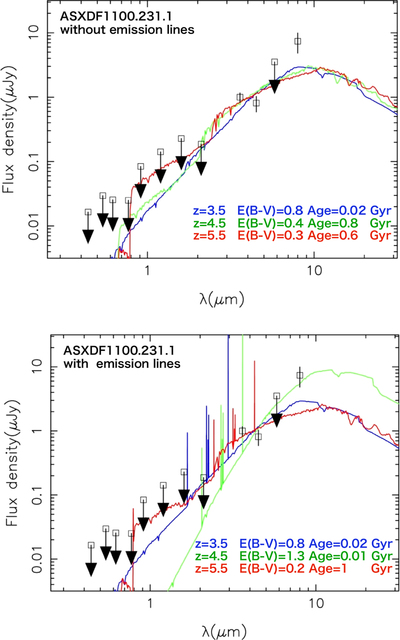
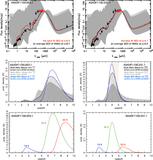
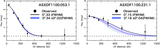
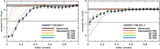
Caption: Figure 11.
ASXDF1100.231.1 SED at observed optical/near-/mid-IR wavelengths. Top: Best-fit SEDs, without emission lines, toward ASXDF1100.231.1 for z = 3.5, 4.5 and 5.5, as obtained with Le Phare. Black points correspond to the observed flux densities, while arrows indicate 2σ upper limits. Bottom: Best-fit SEDs, this time including emission lines.
Other Images in This Article
Show More
Copyright and Terms & Conditions
© 2017. The American Astronomical Society. All rights reserved.
Copyright ©
2025 Astronomy Image Explorer. All Rights Reserved.