Image Details
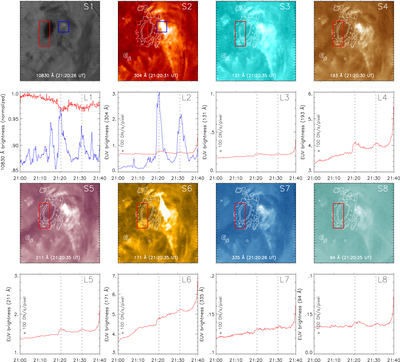
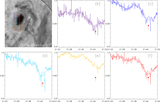
Caption: Figure 6.
Top and the third rows (panels S1–S8): snapshots for the micro-flare at ∼21:20:30 UT taken on the ground by NST and in space by AIA. AIA images are overlaid with contours of sunspots. The second and fourth rows (panels L1–L8): light curves for 10830 Å and EUV brightness from 21:00 UT to 21:40 UT obtained from the boxed areas shown in the upper corresponding images, with red curves from red boxes (over the sunspot) and blue curves from blue ones (over the sites of the two micro-flares). Two vertical dotted lines indicate the peak times of the two micro-flares.
Other Images in This Article
Copyright and Terms & Conditions
© 2016. The American Astronomical Society. All rights reserved.
Copyright ©
2025 Astronomy Image Explorer. All Rights Reserved.