Image Details
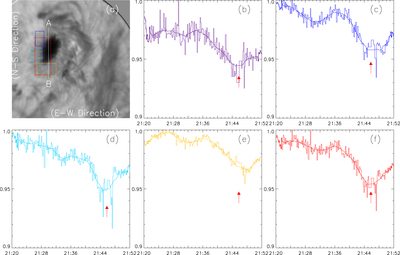
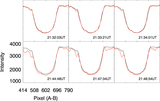
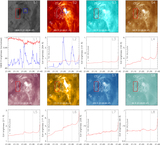
Caption: Figure 4.
Light curves of the five different regions in the sunspot area indicated with five color boxes in the first image. The light curves were obtained from lucky images without speckle reconstruction. The five regions include one umbral region, three different penumbral regions, and one region covering the umbral and penumbral region. The three arrows in each panel mark the onset and two peaks of the flare.
Other Images in This Article
Copyright and Terms & Conditions
© 2016. The American Astronomical Society. All rights reserved.
Copyright ©
2025 Astronomy Image Explorer. All Rights Reserved.