Image Details
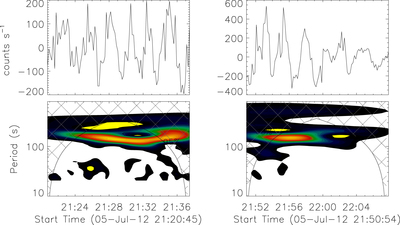
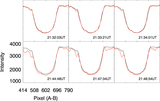
Caption: Figure 3.
Upper panels: the fast component for the intensity obtained from the space–time image along the two dotted lines (Figure 2). Lower panels show their wavelet before and after the flare.
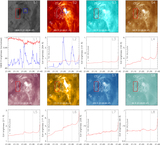
Other Images in This Article
Copyright and Terms & Conditions
© 2016. The American Astronomical Society. All rights reserved.
Copyright ©
2025 Astronomy Image Explorer. All Rights Reserved.