Image Details
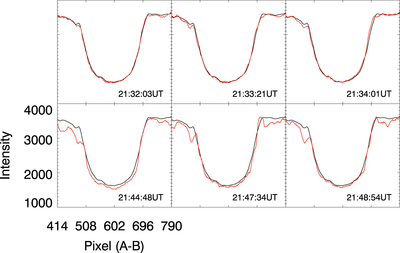
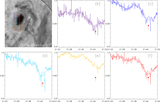
Caption: Figure 5.
Spatial profiles (red) for the intensity of the sunspot at certain times along the slice A–B depicted in Figure 4. The profile (black line) in each panel is the average profile of 101 profiles from 21:20:06 UT to 21:36:58 UT before the onset of flaring.
Other Images in This Article
Copyright and Terms & Conditions
© 2016. The American Astronomical Society. All rights reserved.
Copyright ©
2025 Astronomy Image Explorer. All Rights Reserved.