Image Details
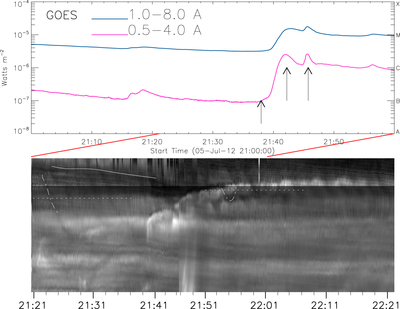
Caption: Figure 2.
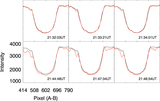
Top panel: GOES X-ray light curve with the soft X-ray emission in the 1–8 Å channel. The flare begins at about 21:38 UT and peaks at 21:42:15 UT and at 21:45:47 UT, each marked by arrows. Bottom panel: a space–time diagram, which was made from speckle-reconstructed images along a slice shown in Figure 1(a). The two white dashed–dotted lines delineate the fishbone-like pattern and the sawtooth-like pattern. The two white dotted lines indicate the location of the spatial profile for wavelet analysis shown in Figure 3. The obvious interface indicates the boundary between the sunspot’s umbral and penumbral regions, displayed with different gray scales. The irregular pattern above the solid line shows the area of umbral flashes distorted by speckle reconstruction.
Other Images in This Article
Copyright and Terms & Conditions
© 2016. The American Astronomical Society. All rights reserved.