Image Details
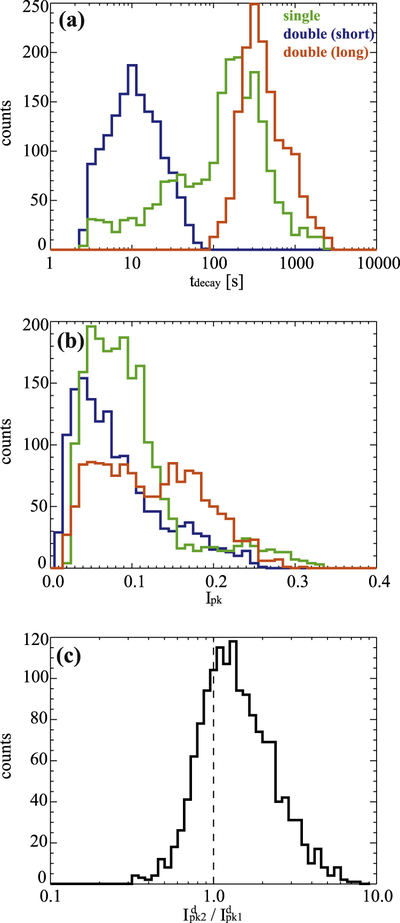
Caption: Figure 7.
(a) Histograms of decay time tdecay of the single component (green), shorter decay time in double components (blue), and longer decay time in double components (red). (b) Histograms of peak intensity Ipk of the single component (green), shorter decay-time component in double components (blue), and longer decay-time component in double components (red). (c) Histogram of the ratio between peak intensity of the shorter decay-time component and peak intensity of longer decay-time component in double components.
Other Images in This Article
Copyright and Terms & Conditions
© 2016. The American Astronomical Society. All rights reserved.
Copyright ©
2025 Astronomy Image Explorer. All Rights Reserved.