Image Details
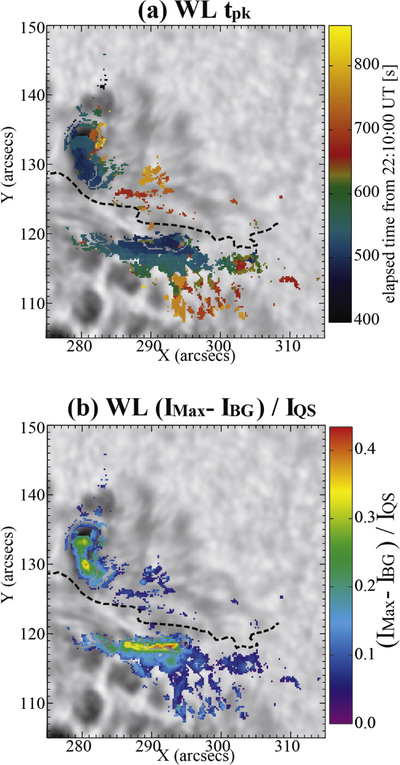
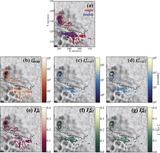
Caption: Figure 5.
Maps of temporal evolution of WL emission. (a) Peak time tpk of WL (colored dots). (b) Peak intensity of WL ﹩[{I}_{\max }﹩ ﹩(\mathrm{WL})-{I}_{\mathrm{BG}}﹩(WL)]/IQS(WL) (colored dots). The grayscale background is the preflare WL intensity map at 22:10:00 UT. The thick, black dotted curve shows the magnetic neutral line.
Other Images in This Article
Copyright and Terms & Conditions
© 2016. The American Astronomical Society. All rights reserved.
Copyright ©
2025 Astronomy Image Explorer. All Rights Reserved.