Image Details
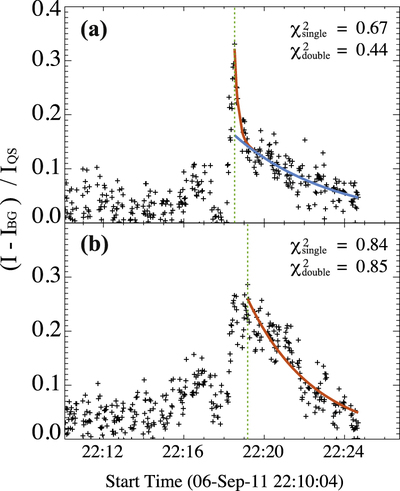
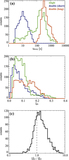
Caption: Figure 4.
(a) An example of a light curve for a single pixel and its fit that identifies it as having two components. (b) An example of a light curve for a single pixel and its fit that identifies it as having a single component. Red and blue curves in panels (a) and (b) are the exponential curve fits to the decaying components with time constants tdecay1 and tdecay2, respectively. The vertical dotted green lines show the peak of the WL enhancement. Reduced ﹩{\chi }^{2}﹩ of the fittings to single component (﹩{\chi }_{\mathrm{single}}^{2}﹩) and double components (﹩{\chi }_{\mathrm{double}}^{2}﹩) are shown at the top-right side in each panel.
Other Images in This Article
Copyright and Terms & Conditions
© 2016. The American Astronomical Society. All rights reserved.