Image Details
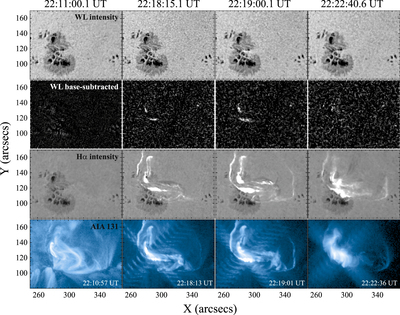
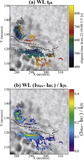
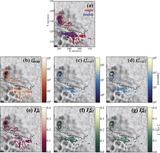
Caption: Figure 2.
Time series of intensity maps of WL, Hα, AIA 131 Å, and base-subtracted images of WL. The time of each set of FISCH images is shown above the panels, and the time of each AIA image is shown at the right-bottom of each image.
Other Images in This Article
Copyright and Terms & Conditions
© 2016. The American Astronomical Society. All rights reserved.
Copyright ©
2025 Astronomy Image Explorer. All Rights Reserved.